Monday, 20 January 2014

HIDE UN WANTED COLUMNS in SSRS

How to hide the columns dynamically in SSRS

Step 1: Initially the The preview will be following, I  have 7 columns(Fields)

Step 2: First you can ADD the parameter and name it as relevant (Hiredate) ,and DATA TYPE--> Boolen
Go to default values -->Specify values-->Write the expression as shown below--> OK-->OK
Step 3: {Observe the parameters here you have the Hiredate} Click on Column Groups-->Advanced mode
Step 4:Click on respective field (My self it is Hiredate) And press (F4) means go to properties of that Field
Step 5:At properties go to Hidden--> Expression-->Select the parameter (Hiredate)-->OK
Step 6:Click on Preview . By default it is false means that field is visible
Step 7:If it is true then the column is in HIDDEN(See the below figure)
Note: (All departments may not be appearing in the same page because this is taken from a report which is all ready had operations on it i.e., previous one)

Automatically name the EXCEL SHEET NAME in SSRS

Keep the default Group name in SSRS of a EXCEL SHEET


{Continue with previous}
Step 1:  Create the report with GROUP BY option (Select the report if all ready exists)
Step 2:  Right click row groups Group Properties --> select page breaks then check Between each instance of a group--OK


Step 3: Go to page name -->Expression
Step 4: Write the expression shown below (I.E., Field name of a group) Click OK
Step 5: Now export the data into Excel Sheet

Step 6: Now observe the Sheet names of a EXCEL SHEET

GAUGES in SSRS

Create a GAUGE in SSRS

{Continue with previous}

Step 1: Create a report with new dataset and name it (Myself it was Gauges shown below) and a parameter deptno.
Right click on design window --> insert --> Gauge
Step 2: Choose any one of the gauges-->OK
Step 3:  Now click on pointer --> go to Expression

Step 4:  Write the expression (my self finding department wise Avg salary)-->OK

Step 4:  Go to radial pointer properties and choose options Pointer fill, Cap fill like so.. then OK

Step 6: We can change the radial Scale properties also. Click OK

Step 7: 
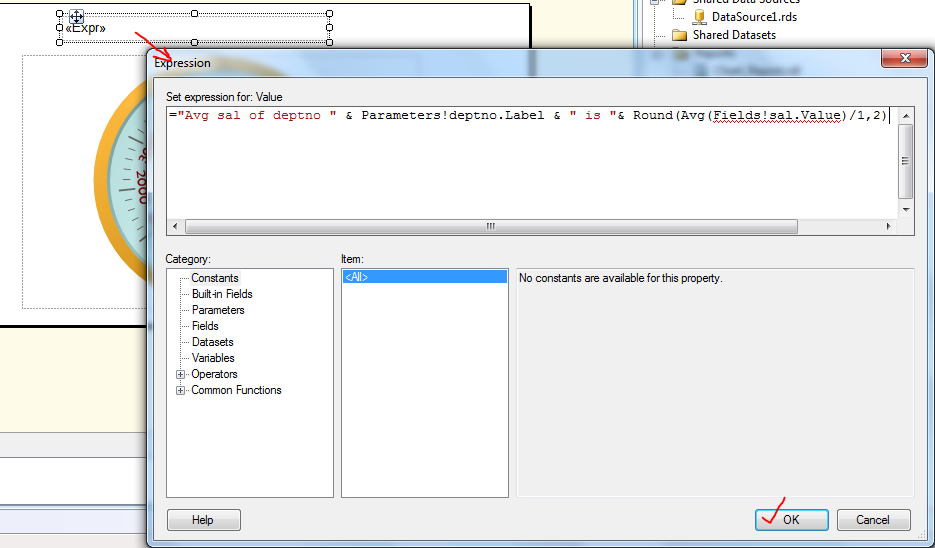
For the label values Write the Expression shown below --> ok
Step 7: Select any department then click on preview

Thursday, 16 January 2014

Display lable values on HEADER part and COUNT OF RECORDS in FOOTER

Lable values on header and number of records in footer level

Stpe 1: Add the text boxes at HEADER and FOOTER 
For the  lable values i.e., deptno write the Expression--> OK
Step 2: Same scenario follow at the footer 
 Step 3: Now click on Preview and see the number of records on footer also test it by selecting Different department numbers

Create SUB-REPORT IN SSRS and pass the PARAMETER to sub-report

Create a sub report in SSRS

Step 1: Create a report and name it (My self Department Table is Subreport). In first dataset1 take all fields, in dataset2 take deptno from DEPT table, then pass the multiple values to parameter using IN CLAUSE at Query level.
 Step 2: Choose one of the report among those  (My_Child_table) as parent table, then right click --> Insert--> Subreport

Step 3:Go to subreport properties by right clicking on subreport wizard
Step 4:  In General settings under Use this report as a subreport From drop down select report(My self is subreport which is created recently )--> click OK
Step 5: Parameters --> Add-->Choose your parameter NAME( deptno)--> value from drop down list--> OK
Step 6: Click on preview and select deptno s -- [find the difference between two figures ]

Create a CHART in SSRS with LABLE

CREATING A CHART

Step 1: Create a data set like shown below

Create another dataset for selecting DEPTNO separately 
Step 2: Now click on window --> insert--> chart
Step 3:Choose type of chart like column,line,shape,bar etc
Step 4: Now click on chart then add integer values for AGGRIGATION and category groups one more field
Step 4: Then Right click Expressions -->chart title properties-->title text Expression -->Write the expression Shown below snapshot -->OK -->OK-->PREVIEW
Step 6:
Final result will be

Calculate DEPARTMENT wise sal and TOTAL sal in SSRS

calculate salaries in SSRS
{Continue with previous}
Step 1: Find here there is only individual salaries but our aim is find Department wise SAL. So follow the steps

Step 2: Click on any field -->Click on Insert Row-->Outside Group -Above
Click 3: Select empty field( means where we want to print value)-->Select Expression...
Step 4: Write the expression then click OK
Step 5: Take a look there is a department wise salaries
Step 6:  Add one more row outside group below and write the ExPRESSION where you want to display the GRAND TOTAL then click OK
Step 7: Click on preview ,See the below image

Wednesday, 15 January 2014

Alternate ROW COLOR for records in SSRS

Alternate ROW COLOR

Step 1: Observe the below image, there is no COLOR
Step 2: Select all the fields and goto PROPERTIES or press(F4)-->click on Backgroundcolor, from drop down and click on Expression
Step 4:Write the expression for backgroundcolor then click OK
Step 5: Now click on PREVIEW